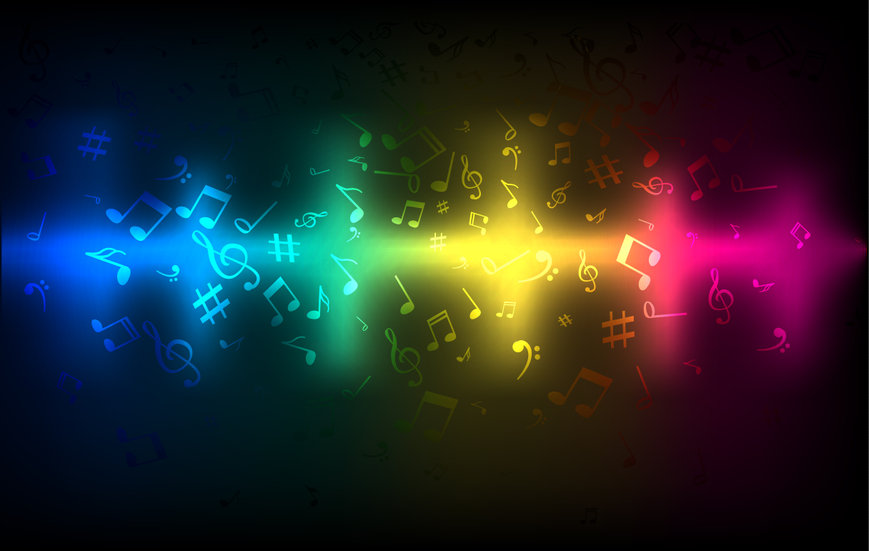
ProSoundWeb: A graphical depiction can often convey an idea better, and quicker, than a whole bunch of words. This is because our brains are mainly image processors, not word processors; the part of our brain that processes words is actually very small in comparison to the part that processes visual information.
7 comments:
This was a really interesting article to read. Sound can be such a complex thing, and I've always respected sound designers/engineers. There are so many factors that have to be carefully considered and blended together. As a lighting person, I have always been interested in sound, but never understood it fully. But this visual representation with descriptions was super helpful. The graphs made it much easier to see how each component interacts with the sound waves and how it affects what we perceive. It's also cool to see how sound quality can be affected not just by EQ, but by the type of mic/filter used initially. Once again, much respect to sound designers because I know systems can become very complex, and they have to balance each unit within the system, and there are a plethora of things that can cause problems. But to have a well-balanced and mixed show is very important.
I didn’t know that the part of our brains that processes words is much smaller than the part that processes visual information, but that’s super interesting and makes sense when I think about it. Going beyond this, I started thinking about language learning; I’ve always thought the best way to learn a language was to talk to people in that language and listen to people talk in that language, but written/visual language might be easier to remember going off of the logic presented in this article. I’m not sure if I really have an opinion about that, I just think it’s an interesting connection. The images that are shown in this article with the various instruments/sounds in a band and how they layer or where they are in the image based on how they sound or where they are within the sound are really interesting and make a lot of sense to me, but I don’t know if I could explain why. I can look at them and I can understand what they’re trying to convey, but without the terminology to really accurately describe them. I think this is partially the point of the article. Very interesting very cool!
I really enjoyed reading this article because it truly gave me a new perspective on mixing and sound engineering. What the author said about people thinking about sound in only audial ways and not using all of our different senses really resonated with me because I often find myself thinking very close mindedly about sound and designing but I feel like if I opened up and really felt sound with different perspectives, I would become a lot more creative. These graphics were super super helpful and I wish there were more because I feel like I really only understood what EQing and how different effects affected the sound that people would hear post by figuring it out myself and just messing around but these graphics really help me visualize what I am doing when I am just messing around. I think these graphics also make sound a lot more concrete and probably more accessible to people who are just starting out and really confused about how different faders and what not affect the sound that the audience hears.
I wonder what a person with chromesthesia would think of this idea. Chromesthesia is a type of synesthesia where a person either actually sees or vividly sees certain shapes and colors in their minds eye when listening to music, or sometimes just when hearing any noise at all. For example, someone might think of cymbal crashes as shiny yellow streaks and guitar as deep red squares. For me, as someone who doesn't have chromesthesia, these charts are very clear and helpful for understanding audio design. However, I feel like they could be even more confusing for someone with chromesthesia because its contradictory visual information to how they already experience the music and sounds. I also wonder if having chromesthesia would make you a better sound designer, or if it would just get too overwhelming.
I love mixing and these visuals provided are very informative and accurate, especially when describing the effects of EQ. I think it’s very interesting how our brains pick up visual information more than words on a page or sounds. Sound is such a complex concept and the way he made these visuals is just amazing. From the different fonts to the different colors, to the layering, whether or not the words are solid or fuzzy, the size, the layering, is just amazing.
Audio through pictures can also be a way for those who are hearing impaired to understand more about how experiencing sound works. On the other hand, people process things in different ways. I, for one, can’t take the images and understand them as audio. While this may work for some people there are plenty of people this visualization technique will not work for, and even if people can understand it, some may interpret the audio map differently than others. Relying on people’s ability to translate images into audio can lead to confusion and things not going to plan, something that can delay a production.
This was quite a fascinating visualization of how instruments and musical sounds work. I have to agree with the title, I don’t think I’ve ever seen or listened to an explanation of sound that I understood as thoroughly as I did these visuals. It really gives another visual to the concept of layering sound. Most of my experience with mixing sound has been fairly limited and mostly just going off of volume and how nice it sounds, however there is clearly a technique to it and things to listen for that I just don’t understand yet. The term balance too makes a lot more sense with these visuals in the sense of a visual balance as well as an auditory balance. I think it would be interesting to see this sort of visual with the different types of singers as well, sopranos, altos, tenors etc to see how they visually fall on this spectrum.
Post a Comment